|
FFSM++
1.1.0
French Forest Sector Model ++
|
|
FFSM++
1.1.0
French Forest Sector Model ++
|
Functions | |
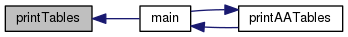
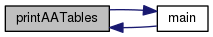
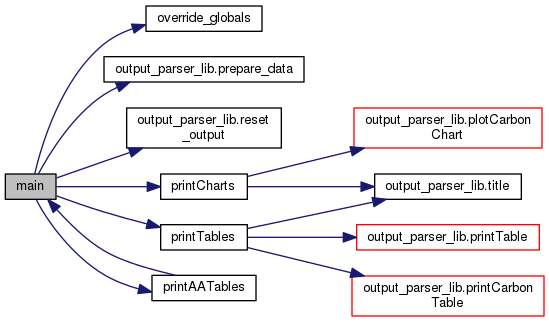
| def | main () |
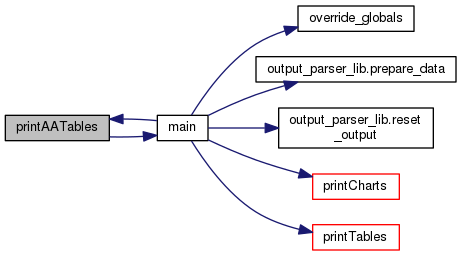
| def | override_globals () |
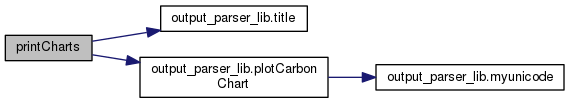
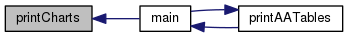
| def | printCharts () |
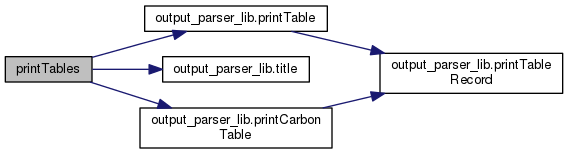
| def | printTables () |
| def | printAATables () |
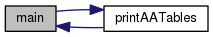
| def output_parser_example.main | ( | ) |
Definition at line 11 of file output_parser_example.py.
Referenced by printAATables().
| def output_parser_example.override_globals | ( | ) |
Definition at line 32 of file output_parser_example.py.
Referenced by main().

| def output_parser_example.printAATables | ( | ) |
Definition at line 120 of file output_parser_example.py.
Referenced by main().
| def output_parser_example.printCharts | ( | ) |
Definition at line 89 of file output_parser_example.py.
Referenced by main().
| def output_parser_example.printTables | ( | ) |
Definition at line 99 of file output_parser_example.py.
Referenced by main().